User Tools
Table of Contents
POSTDOCTORAL RESERACH
Python and SOM
- python module by Vahid Moosavi of CAAD, sompy
- another SOM python implementation, somoclu: https://somoclu.readthedocs.io/en/stable/index.html
- SOM Java Toolbox created at TU Wien http://www.ifs.tuwien.ac.at/dm/somtoolbox/
- Twitter sentiment analysis with Python: https://towardsdatascience.com/another-twitter-sentiment-analysis-with-python-part-5-50b4e87d9bdd
Scraping and mining twitter streams
following these tutorials: Introduction to Text Mining using Twitter Streaming API and Python & a beginners guide to streamed data from Twitter
- get Twitter API keys from https://apps.twitter.com
- scrape tweet stream using python streaming script
- mine the tweets using python mining script
A resourceful guide for Twitter textmining in Python: https://marcobonzanini.com/2015/03/23/mining-twitter-data-with-python-part-4-rugby-and-term-co-occurrences/
Scraping and mining Dezeen articles
- with scrapy
The setup: python3 in the conda environment
$ conda create -n bots python=3.4 # create a virtual environment named "bots"
$ source activate bots # activate the environment; check if active: conda info --envs
$ conda install -n bots -c conda-forge scrapy # install scrapy for the named environment
Run scrapy directly from the shell:
$ scrapy startproject dezeen # start a project
Detailed instructions here: https://doc.scrapy.org/en/latest/intro/tutorial.html#creating-a-project
Create a _spider_ in the folder dezeen/dezeen/spiders/ within which you will create a class that will declare its' name. This name will be used to call the spider from the console:
$ scrapy crawl spider_name
It is also important to declare fields in pages that will be scraped. This is done in the dezeen/items.py file, using eg (the Class is already declared when you start project).
Class DezeenItem(Item):
title = Field()
link = Field()
description = Field()
These fields will be later used as part of the item dictionary (e.g. item['link'])
DOCTORAL RESEARCH
»»»»»»»»»>!>!»> * * * »»»»> ? ? !! »»>
a design approach where wireless signals can be employed as a parameter in shaping of spaces
read more on the theoretical part of this research on the thesis blog emperors.kucjica.org
Connect or Not
Connect or Not, IST Lisbon

Connect or Not, K4, Ljubljana

Connect or Not, Buhne A, Zurich

Quadricone
Les Urbaines installation in Espace Arlaud, Lausanne

Stage Digital I scaled model, Buhne A, Zurich

RKNFG
RKNFG installation was developed during a three week residency in Atelierhaus Salzamt. It was shown at the consecutive exhibition Expand, Explore Expose in the Salzamt gallery, September 2012
Details on hardware, software and development of RKNFG

—
COMPONENTS:
connect or not application
http://connectornot.emperors.kucjica.org
@ playstore: https://play.google.com/store/apps/details?id=net.lmag.connectornot
data visualisation
lisboa: connect or not at IST Alameda campus
Beagle Bone Black + 2 Arduinos + 4 RGBW high power LEDs + 4 servo motors + 7m stretchable fabric + Android app + people
LED wall @ EPFL (apr/may 2014)
MMC K6/4 residency (jan/feb 2014)
Workshop @ MMC Zavod 6/4, January 2014
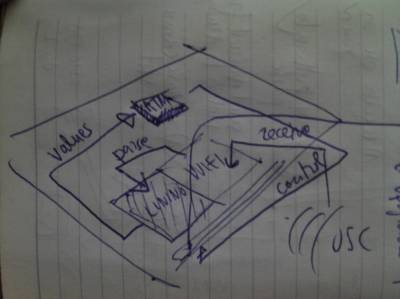
how to interface wirelessness with space? use light, sound and movement to render experiencable the events that take place in the field of high frequency electromagnetic radiation

what are wireless signals?
how can we perceive them?
- computer (or other) wireless card (wifi only)
- mobile phone, smart phone, tablet (umts, gst, wifi)
how can we explore / exploit them?
workflow
- install connect or not application
- receive data in pd
- send values to arduino
- control lights, sound, motors
receive OSC data
- start pd-extended
- create the basic receiving objects
- run connect or not on your phone, press START
- observe the data you receive
- create the structure to receive each information separately (use OSC addresses)
arduino controls: LED test
- connect your arduino.
- start the arduino IDE
- under Tools > choose the correct Board (eg. Arduino Uno) and Port (eg. /dev/ttyACM0)
- paste the following code in your sketch:
- start pd-extended
- paste the following code in a text editor and save with .pd extension
- open the file in pd
- connect the LED to pin 8 (longer leg) and ground (shorter leg)
- change the values on the slider and observe the LED switching on and off; use messages 0 and 255 to do the same
arduino controls: sound
- connect the arduino and start the IDE (follow the steps from the LED test)
- connect the speaker to pin 8 (red wire) and ground (black wire)
- paste the following code in your sketch and upload it to the board
- paste the pd code into a text file, save with a .pd extension and open in pd
- change the value of the green slider (pitch)
arduino controls: motors
- connect the arduino and start the IDE (follow the steps from the LED test)
- paste the following code in your IDE sketch and upload it to the board
- connect the data (usually yellow) wire of the motor to pin 11. connect power (red wire) and ground (black wire) to power (5v) and ground of arduino
- paste the following code in your favourite text editor and save with .pd extension; then open the file with pd-extended
finally, connect the OSC data stream to a physical output
- open the receiving pd patch further
- open the pd control patch (light, sound, movement)
- copy the objects and paste to the first patch
- assign received values to different reactions of the physical system (blinking of light, speed of movement, sound pitch and duration…); fiddle with received values until you reach desired interaction;
results

technical development: general
step 1: scanning wifi
airodump-ng
- airodump-ng: scans the surrounding APs; returns details on ESSID, encryption type, power level, packets going through… writes the dump to a file, able to write .cap and .csv files;
- has to be run as sudo
/etc/init.d/network-manager stop
killall -9 nm-applet
airmon-ng start [iface]
airodump-ng [monitor iface]
iwlist
- iwlist scan returns a list of access points with their ESSID, quality, frequency, power… and can write to a file, for example like this
iwlist [iface] scanning
scripting wifi scan with python
problems:
- output of aircrack scan cannot be passed further to python directly
- need data on all available access points in the range of my wifi card
- need data on network activity (e.g. how many devices are connected to it, ideally what is the data flow)
- most network tools scan traffic within a specific network, but do not give an overview at the same time
solutions:
wardrivintg.py
a python script that calls in the results of iwlist scanand returns a list of ESSIDs
scapy
download and install scapy: http://www.secdev.org/projects/scapy/doc/installation.html
more on scapy usage and and examples
packet snffing with scapy + wifizoo
pcapy
step 2: controling the motors
arduino servo
try loop movement with arduino servo 180 test
interactive positioning using python serial arduino servo serial interactive
python + arduino API
- uploaded this code to arduino extended-python-arduino-prototyping-api
- saved this arduino module in the project folder
- tested two motors with this python script
- firgelli linear actuators: python sync test script
python + arduino, 4 servo control
- arduino firmware, controlls from python principialabs, 4 axis servo control
step 3: pass the wifi scan (airodump-ng) data to the motors
using the extended-python-arduino-prototyping-api i call [motor].write(value) with a value determined from the scan
for example, with a running instance of airodump-ng which scans the traffic on a particular network ( –bssid 14:D6:4D:B6:97:3C) and writing to a file (-w /home/selena/doc/synergia/sator/scanning/salzamt1109)
airodump-ng --bssid 14:D6:4D:B6:97:3C -w /home/selena/doc/synergia/sator/scanning/salzamt1109 mon0
we can read the amount of data packets that have passed through the network with a python function like this:
def lookup(table):
    scan=open(table)
    next(scan)
    scanDict=csv.DictReader(scan, delimiter=',')
    for adict in scanDict:
        if adict.has_key(' # IV'):
            data=adict.get(' # IV')
            print data


airodump='/home/selena/doc/synergia/sator/scanning/salzamt1109-01.csv'
when we call the lookup function, it returns the value of the '# IV' key in a dictionary that is contained in the DictReader object 'scanDict'. the returned value is a string, so we have to turn it into an integer.
packets=int(lookup(airodump))
the full script is available here
other
